Network troubleshooting with MTR/WinMTR
Introduction
MTR (My Traceroute) and WinMTR are tools used to track how data travels from your computer to a server, and to identify where delays or losses may occur along the way. They continuously send packets to each hop on the route to a target host and measure performance at every step. These tools are especially useful for identifying network degradation affecting services like game servers, streaming, and VoIP.
In this guide, you'll learn how to install and use MTR or WinMTR to identify and troubleshoot network problems like high latency and packet loss.
Why Use MTR or WinMTR?
When users experience poor network performance - like lag in games, buffering in streams, or voice chat disruptions - the issue could be anywhere along the network route: from the user's ISP to internet exchanges, or even within the data center itself.
MTR and WinMTR provide real-time, hop-by-hop analysis of packet loss and latency. This allows both users and support teams to pinpoint where problems occur.
What MTR Helps You Detect:
- Intermittent loss: Temporary drops at one hop that do not persist may be firewall filtering and not a problem.
- Persistent loss after a hop: If packet loss starts at a node and continues through all subsequent ones, this indicates real packet loss.
- Latency anomalies: High
AvgorWrstvalues on a particular hop can highlight routing or congestion issues. - Firewall filtering: A single hop reporting 100% loss but later hops responding normally usually means ICMP is being filtered.
Providing a complete MTR or WinMTR report during the incident allows data centers to analyze problems with precision.
Glossary of Key Metrics
| Term | Description |
|---|---|
| Host | IP or hostname of each router on the path to the destination |
| Loss% | Percentage of packet loss observed at that node |
| Snt | Number of packets sent to the host |
| Recv | Number of packets successfully received |
| Best | Lowest ping recorded during the test |
| Avg | Average round-trip time in milliseconds (ms) |
| Wrst | Highest ping recorded |
| Last | Ping time of the most recent packet sent |
| StDev | Variation in response time (lower is more stable) |
Installation
Windows (WinMTR)
You can download WinMTR for Windows from the FSHOST page.
- Unzip and launch the program.
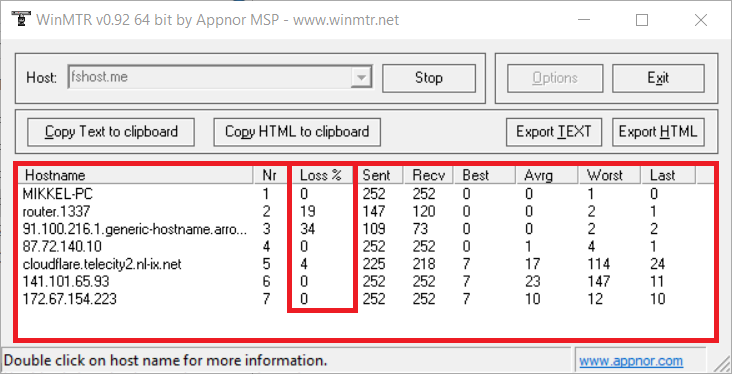
- Enter the IP address or hostname you want to test (e.g., the game server).
- Click “Start” to begin the test.
- Run the test during the issue for accurate results.
- Click “Copy Text to clipboard” or export to save your report.

Linux (MTR)
MTR can be installed on Linux using your package manager. It must be run via SSH on the server or local machine.
To install:
sudo apt install -y mtr-tiny
To start a test:
mtr [IP or hostname]
Stop the test with Ctrl + C once sufficient data is collected.
Example Output
Click to view traceroute output
My traceroute  [v0.95]
localhost (0.0.0.0) -> de34.fsho.st (de34.fsho.st) 2024-07-15T12:02:55+0200

Host                                    Packets               Pings
                                       Loss%   Snt  Last  Avg  Best  Wrst  StDev
 1. router.1337                         0.0%    23   0.3   0.4  0.3   0.6    0.1
 2. isp                                 0.0%    23   0.7   0.6  0.5   0.7    0.1
 3. 87.72.140.10                        0.0%    23   1.3   1.3  1.0   1.7    0.2
 4. danskabel.nikhef.openpeering.nl    0.0%    23  10.1  10.7 10.0  15.0    1.1
 5. ams-ix.retn.net                     0.0%    23  11.5  13.6 11.4  35.9    5.9
 6. ae22-4.rt.irx.fkt.de.retn.net      4.3%    23  14.1  14.0 13.8  14.4    0.2
 7. (waiting for reply)
 8. (waiting for reply)
 9. fra11.cc1.as48314.net              0.0%    23  21.8  23.4 18.7  40.3    5.3
10. fra1.cc1.as48314.net               0.0%    22  93.2  40.9 19.7  95.6   23.3
11. de34.fsho.st                        0.0%    22  18.3  18.4 18.2  18.8    0.1
Creating a Useful Report
- Perform the MTR/WinMTR test while the issue is occurring.
- Include both outbound (from you to server) and inbound (server to you) tests if possible.
- Copy and share the full report, preferably in text format.
- Avoid screenshots unless absolutely necessary, as raw text is easier to analyze.
Evaluating the Results
When reading a report, consider:
- Consistent packet loss across multiple hops usually points to an upstream issue.
- Loss at a single node that doesn’t continue downstream is often a filtering firewall.
- High
WrstorStDevmay indicate instability, even if packet loss is low. - Contact support with this report to help them pinpoint and escalate the issue efficiently.
Understanding Packet Loss in MTR Reports
Interpreting packet loss correctly is essential. Not all loss is a problem - some is expected or intentional (e.g., due to security filters). Below are common scenarios and what they usually mean:
🔐 Loss at an Early Hop (Firewall or DDoS Protection)
Example:
2. firewall.provider.net          100%   100   ---   ---   ---   ---   ---
3. router.upstream.net             0%    100   15    16    14    20
✅ This is normal.
Some firewalls or anti-DDoS systems intentionally block ICMP/ping replies to avoid abuse. If the next hops respond normally with 0% packet loss, there is no problem.
🛑 Loss That Starts and Persists Across All Subsequent Hops
Example:
6. transit.provider.net           30%   100   55    60    54    120
7. core.router.datacenter.net     30%   100   60    65    55    130
8. destination.server.net         30%   100   63    67    57    140
🚨 This is a real issue.
If packet loss starts at a specific hop and continues all the way to the destination, it likely indicates a problem at that node or upstream - such as congestion, misconfiguration, or a faulty router.
🎯 Loss Only at the Final Hop (Destination)
Example:
10. destination.server.net 20% 100 60 70 59 120
🟠 May or may not be a problem.
If only the last hop shows loss, check if services (like a game or website) are actually having issues. Some servers deprioritize or drop ICMP echo replies - so occasional packet loss here could be harmless.
But if users are actively experiencing disconnects, rubberbanding, or buffering, the packet loss at the destination is real and significant.
🧱 One Hop Shows 100% Loss, Others Don’t
Example:
5. private.firewall.net           100%   100   ---   ---   ---   ---
6. core.backbone.net               0%    100   30    35    29    50
✅ Not a problem.
This is ICMP filtering - the hop received the packet but chose not to reply. Because all subsequent hops respond normally, the connection isn't impacted.
🌐 Loss in the First Few Hops (Local Network or ISP)
Example:
1. home.router.local              0%    100
2. isp-gateway.local               5%    100
3. upstream.core.isp               8%    100
⚠️ Check your local setup or contact your ISP.
Loss in the first few hops usually means the problem is closer to you, such as:
- Wi-Fi interference or signal degradation
- Faulty Ethernet cable
- Problems at your ISP’s edge
Try retesting using a wired connection and rebooting your router or modem.